


A BUYERS MARKET
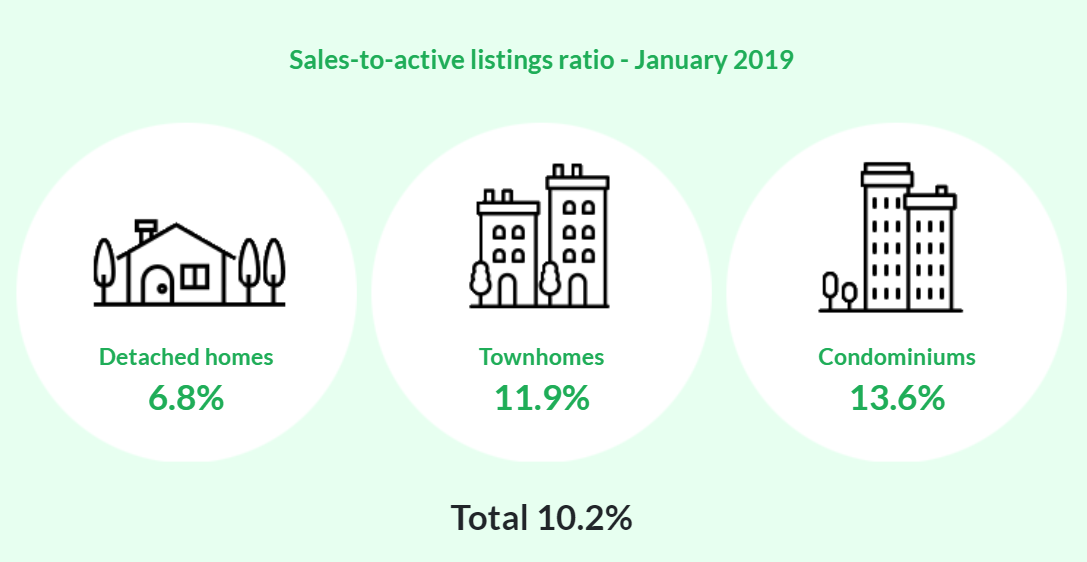
For all property types, the sales-to-active listings ratio for last month was 10.2%. By property type, the ratio was 6.8% for detached homes, 11.9% for townhomes, and 13.6% for condos. Generally, analysts say that downward pressure on home prices occurs when the ratio dips below the 12% mark for a sustained period, while home prices often experience upward pressure when it surpasses 20% over several months.
HOME PRICES COMPARED TO A YEAR AGO JANUARY 2018:
- Detached homes dropped 9%
- Condos declined 1.7%
- Townhomes decreased 0.5%
![]()
BUYERS’ BEST BETS – Top Buyers’ Markets last month were detached houses in Richmond, Vancouver Westside and West Vancouver.
SELLERS’ BEST BETS – Top Sellers’ Markets last month were condos/townhomes in Maple Ridge, Port Moody and New Westminister.
To receive a complimentary SnapStats Report, email info@yourhometeam.com
HOME LISTINGS INCREASE WHILE BUYERS REMAIN IN HOLDING PATTERN
Feb 4, 2019 – VANCOUVER, BC – Home listings continue to increase across all housing categories in the Metro Vancouver housing market while home buyer activity remains below historical averages.
The Real Estate Board of Greater Vancouver (REBGV) reports that residential home sales in the region totalled 1,103 in January 2019, a 39.3 per cent decrease from the 1,818 sales recorded in January 2018, and a 2.9 per cent increase from the 1,072 homes sold in December 2018.
Last month’s sales were 36.3 per cent below the 10-year January sales average and were the lowest January-sales total since 2009.
“Realtors are seeing more traffic at open houses compared to recent months, however, buyers are choosing to remain in a holding pattern for the time being.” – Phil Moore, REBGV president
There were 4,848 detached, attached and apartment homes newly listed for sale on the Multiple Listing Service® (MLS®) in Metro Vancouver in January 2019. This represents a 27.7 per cent increase compared to the 3,796 homes listed in January 2018 and a 244.6 per cent increase compared to the 1,407 homes listed in December 2018.
The total number of homes currently listed for sale on the MLS® system in Metro Vancouver is 10,808, a 55.6 per cent increase compared to January 2018 (6,947) and a 5.2 per cent increase compared to December 2018 (10,275).
For all property types, the sales-to-active listings ratio for January 2019 is 10.2 per cent. By property type, the ratio is 6.8 per cent for detached homes, 11.9 per cent for townhomes, and 13.6 per cent for condominiums.
Generally, analysts say that downward pressure on home prices occurs when the ratio dips below the 12 per cent mark for a sustained period, while home prices often experience upward pressure when it surpasses 20 per cent over several months.
Home prices have edged down across all home types in the region over the last seven months,” Moore said.
The MLS® Home Price Index composite benchmark price for all residential homes in Metro Vancouver is currently $1,019,600. This represents a 4.5 per cent decrease over January 2018, and a 7.2 per cent decrease over the past six months.
“Economic fundamentals underpinning our market for home buyers and sellers remain strong. Today’s market conditions are largely the result of the mortgage stress test that the federal government imposed at the beginning of last year,” Moore said. “This measure, coupled with an increase in mortgage rates, took away as much as 25 per cent of purchasing power from many home buyers trying to enter the market.”
Sales of detached homes in January 2019 reached 339, a 30.4 per cent decrease from the 487 detached sales recorded in January 2018. The benchmark price for detached homes is $1,453,400. This represents a 9.1 per cent decrease from January 2018, and an 8.3 per cent decrease over the past six months.
Sales of apartment homes reached 559 in January 2019, a 44.8 per cent decrease compared to the 1,012 sales in January 2018. The benchmark price of an apartment property is $658,600. This represents a 1.7 per cent decrease from January 2018, and a 6.6 per cent decrease over the past six months.
Attached home sales in January 2019 totalled 205, a 35.7 per cent decrease compared to the 319 sales in January 2018. The benchmark price of an attached unit is $800,600. This represents a 0.5 per cent decrease from January 2018, and a 6.2 per cent decrease over the past six months.


