


Latest Housing Statistics Reveal Mixed Markets
Generally, prices have softened across all types of housing in Greater Vancouver, although house prices have declined more than condos and townhouses. Detached home prices are down 10.5%, while condos and townhomes are 6% lower than compared to March 2018.
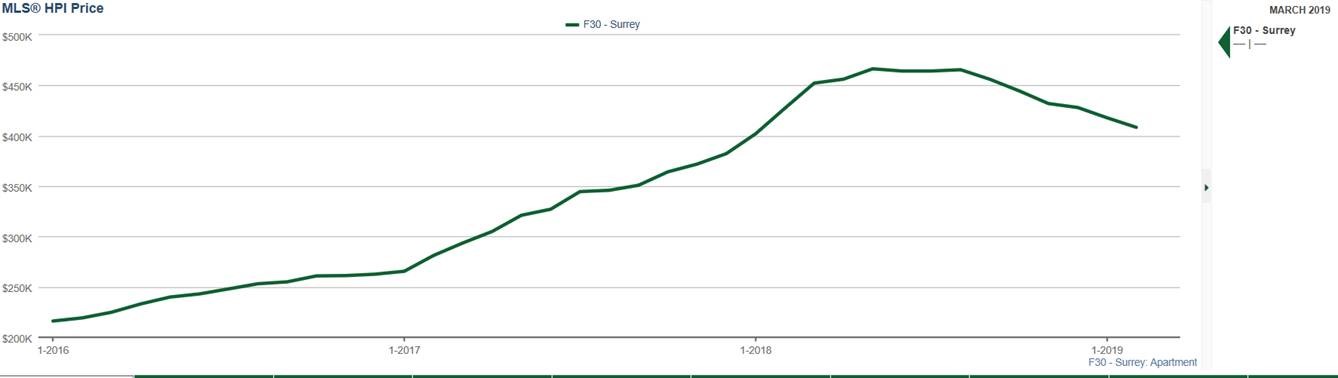
However, market activity varies greatly from location to location. For example, Kitsilano condo prices recently changed course and have been trending upwards for two months in a row although they are currently still 5.5% lower than one year ago. Meanwhile Surrey condo prices continue to trend downwards. Contact info@yourhometeam.com to get graphs for other sub-areas.
KITSILANO CONDO PRICE

SURREY CONDO PRICE
SALES VOLUME
Home sales volume across all property types and across all sub-areas was 31% lower compared to this time last year and the lowest number of March home sales since 1986. Falling home sales in Metro Vancouver are “largely policy induced” and policymakers are “using policy to delay housing demand and feeding disruptive cycles,” according to the new president of the Real Estate Board of Greater Vancouver.
SALES TO ACTIVE RATIO (Sales Ratio)
The overall sales-to-active listings ratio for all property types is standing at 13.5%, which is a balanced market. However, some areas have very strong sales ratios over 25% while other areas are well below 10%. A balanced market is 12% to 20% sales ratio. Anything below that is considered a Buyers’ Market, and higher is a Sellers’ Market.
![]()
BUYERS’ MARKETS (where sales are weakest and Sales Ratios are low)
Houses: Burnaby 8%, Port Moody 8%, Arbutus 6%, Point Grey 7%, Shaughnessy 1%, Southlands 3%, Tsawwassen 5%, Richmond 7%
Townhouses and Condos: Cambie 6%, Coal Harbour 6%, Marpole 7%, South Granville 7%, Knight 5%, Fraserview 4%, West Van 7%
SELLERS’ MARKETS (where sales are strongest and Sales Ratios are high)
Houses: Kitsilano 23%, Quilchena 23%, Hastings East 33%, Deep Cove 36%, Lower Lonsdale 33%, Lynn Valley 38%
Townhouse and Condos: Fairview 31%, Kitsilano 25%, Mount Pleasant 38%, Point Grey 56%, Quilchena 27%, Shaughnessy 57%, Hastings East 43%, Fraser 33%, Coquitlam 44%, Port Moody 32%, Shaughnessy 57%
Request a complimentary SnapStats Report, by emailing info@yourhometeam.com
| April 2, 2019 |
Prospective home buyers remain on the sidelines in MarchMetro Vancouver home sales dipped to the lowest levels seen in March in more than three decades. The Real Estate Board of Greater Vancouver (REBGV) reports that residential home sales in the region totalled 1,727 in March 2019, a 31.4 per cent decrease from the 2,517 sales recorded in March 2018, and a 16.4 per cent increase from the 1,484 homes sold in February 2019. Last month’s sales were 46.3 per cent below the 10-year March sales average and was the lowest total for the month since 1986. “Housing demand today isn’t aligning with our growing economy and low unemployment rates. The market trends we’re seeing are largely policy induced,” Ashley Smith, REBGV president said. “For three years, governments at all levels have imposed new taxes and borrowing requirements on to the housing market.” “What policymakers are failing to recognize is that demand-side measures don’t eliminate demand, they sideline potential home buyers in the short term. That demand is ultimately satisfied down the line because shelter needs don’t go away. Using public policy to delay local demand in the housing market just feeds disruptive cycles that have been so well-documented in our region.” There were 4,949 detached, attached and apartment properties newly listed for sale on the Multiple Listing Service® (MLS®) in Metro Vancouver in March 2019. This represents an 11.2 per cent increase compared to the 4,450 homes listed in March 2018 and a 27.2 per cent increase compared to February 2019 when 3,892 homes were listed. The total number of homes currently listed for sale on the MLS® system in Metro Vancouver is 12,774, a 52.4 per cent increase compared to March 2018 (8,380) and a 10.2 per cent increase compared to February 2019 (11,590). For all property types, the sales-to-active listings ratio for March 2019 is 13.5 per cent. By property type, the ratio is 9.4 per cent for detached homes, 15.9 per cent for townhomes, and 17.2 per cent for apartments. Generally, analysts say downward pressure on home prices occurs when the ratio dips below 12 per cent for a sustained period, while home prices often experience upward pressure when it surpasses 20 per cent over several months. The MLS® Home Price Index composite benchmark price for all residential properties in Metro Vancouver is currently $1,011,200. This represents a 7.7 per cent decrease from March 2018, and a 0.5 per cent decrease compared to February 2019. Sales of detached homes in March 2019 reached 529, a 26.7 per cent decrease from the 722 sales in March 2018. The benchmark price for a detached home is $1,437,100. This represents a 10.5 per cent decrease from March 2018, and a 0.4 per cent decrease compared to February 2019. Sales of apartment homes reached 873 in March 2019, a 35.3 per cent decrease compared to the 1,349 sales in March 2018. The benchmark price of an apartment property is $656,900. This represents a 5.9 per cent decrease from March 2018, and a 0.5 per cent decrease compared to February 2019. Attached home sales in March 2019 totalled 325, a 27.1 per cent decrease compared to the 446 sales in March 2018. The benchmark price of an attached home is $783,600. This represents a six per cent decrease from March 2018, and a 0.7 per cent decrease compared to February 2019. Download the March 2019 stats package. |


