


In the first part of the year many prospective buyers were in a holding pattern waiting to see how prices would react to the mortgage stress test, new taxes, and other policy changes. Buyer confidence started to return in late summer and we saw above-average sales in the second part of 2019.
As a result, prices dropped in the first 9 months of 2019 and then rallied in the last quarter, so prices for all types of homes, including both detached and attached, finished the year lower than this time last year, but higher than Summer 2019. However, sales levels and prices varied by area with some neighbourhoods experiencing multiple offers and others remaining relatively stable.
Furthermore, 2019 BC Assessments were completed on or before July 1, 2019 when prices were near the bottom of the curve for the year and prices were still trending downwards, so those government assessments were already out of date by the time they were released to the public in December 2019.
“We didn’t see typical seasonal patterns in 2019. Home buyer demand was quieter in the normally busy spring season and it picked up in the second half of the year” – Ashley Smith, REBGV president

The sales-to-active listings ratio for December 2019 was 23.4 per cent. By property type, the ratio was 15.2 per cent for detached homes, 25.7 per cent for townhomes, and 32.5 per cent for apartments. Analysts say that downward pressure on home prices occurs when the ratio dips below 12 per cent for a sustained period, while home prices often experience upward pressure when it surpasses 20 per cent over several months.
![]()
Seller Markets – Houses: East Vancouver, South Vancouver, North Vancouver, Mackenzie Heights, Arbutus, Kitsilano
Seller Markets – Townhouses & Condos: East Vancouver, North Vancouver, Fairview, Quilchena, Kitsilano
Buyer Markets – Houses: Kerrisdale, Cambie, South Granville, Collingwood, West Vancouver, Tsawwassen, Ladner
Buyer Markets – Townhouses & Condos: Oakridge, Coal Harbour, UBC University, Ambleside, Park Royal, Bridgeport
***Sales activity and prices vary by region, so contact our team to get more details on specific areas.
To receive a complimentary SnapStats Report, email info@yourhometeam.com
Home sales decline below long-term averages in 2019 despite increased demand to end the year
The Metro Vancouver housing market experienced below average sales activity and moderate price declines in 2019.
The Real Estate Board of Greater Vancouver (REBGV) reports that sales of detached, attached and apartment homes reached 25,351 in 2019, a three per cent increase from the 24,619 sales recorded in 2018, and a 29.6 per cent decrease over the 35,993 residential sales in 2017.
Last year’s sales total was 20.3 per cent below the region’s 10-year sales average.
“We didn’t see typical seasonal patterns in 2019. Home buyer demand was quieter in the normally busy spring season and it picked up in the second half of the year,” Ashley Smith, REBGV president said. “In terms of home values, prices dipped between two and four per cent across the region last year depending on property type.”
Home listings on the Multiple Listing Service® (MLS®) in Metro Vancouver reached 51,918 in 2019. This is a 3.2 per cent decrease compared to the 53,614 homes listed in 2018 and a five per cent decrease compared to the 54,655 homes listed in 2017.Last year’s listings total was 7.6 per cent below the 10-year average.
“Home buyer confidence was a factor throughout the year. In the first quarter, many prospective buyers were in a holding pattern, waiting to see how prices would react to the mortgage stress test, new taxes, and other policy changes,” Smith said. “Confidence started to return in the summer, and we saw above average sales in the final quarter of 2019.”
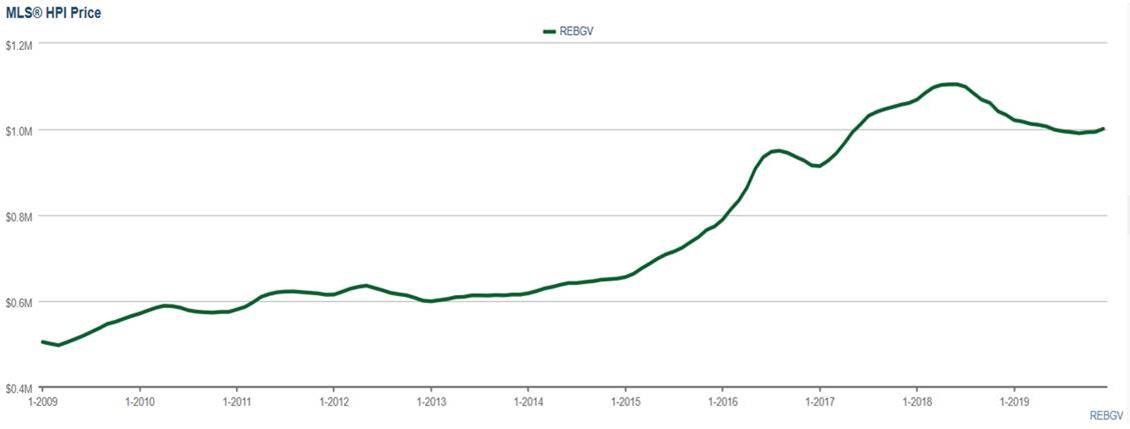
The MLS® HPI composite benchmark price for all residential properties in Metro Vancouver ends the year at $1,001,000. This is a 3.1 per cent decrease compared to December 2018.
The benchmark price of apartments decreased 2.7 per cent in the region last year. Townhomes decreased 2.4 per cent and detached homes decreased four per cent.
DECEMBER SUMMARY
REBGV reports that residential home sales in the region totalled 2,016 in December 2019, an 88.1 per cent increase from the 1,072 sales recorded in December 2018, and a 19.3 per cent decrease from the 2,498 homes sold in November 2019.
Last month’s sales were 9.5 per cent above the 10-year December sales average.
There were 1,588 detached, attached and apartment properties newly listed for sale on the MLS® in Metro Vancouver in December 2019. This represents a 12.9 per cent increase compared to the 1,407 homes listed in December 2018 and a 46.8 per cent decrease compared to November 2019 when 2,987 homes were listed.
The total number of homes currently listed for sale on the MLS® system in Metro Vancouver is 8,603, a 16.3 per cent decrease compared to December 2018 (10,275) and a 20.1 per cent decrease compared to November 2019 (10,770).
For all property types, the sales-to-active listings ratio for December 2019 is 23.4 per cent. By property type, the ratio is 15.2 per cent for detached homes, 25.7 per cent for townhomes, and 32.5 per cent for apartments.
Generally, analysts say that downward pressure on home prices occurs when the ratio dips below 12 per cent for a sustained period, while home prices often experience upward pressure when it surpasses 20 per cent over several months.
Sales of detached homes in December 2019 reached 599, a 72.1 per cent increase from the 348 detached sales recorded in December 2018. The benchmark price for detached properties is $1,423,500. This represents a four per cent decrease from December 2018, and a 0.6 per cent increase compared to November 2019.
Sales of apartment homes reached 1,053 in December 2019, a 96.8 per cent increase compared to the 535 sales in December 2018. The benchmark price of an apartment property is $656,700. This represents a 2.7 per cent decrease from December 2018, and a 0.8 per cent increase compared to November 2019.
Attached home sales in December 2019 totalled 364, a 92.6 per cent increase compared to the 189 sales in December 2018. The benchmark price of an attached home is $778,400. This represents a 2.4 per cent decrease from December 2018, and a 0.7 per cent increase compared to November 2019.
Download the December 2019 stats package


