


After sitting on the sidelines for roughly a year, many buyers are now jumping back into the Vancouver market and soaking up inventory.
Vancouver home sales were 45% higher last month compared to October 2018, and inventory that had piled up is now thinning out.
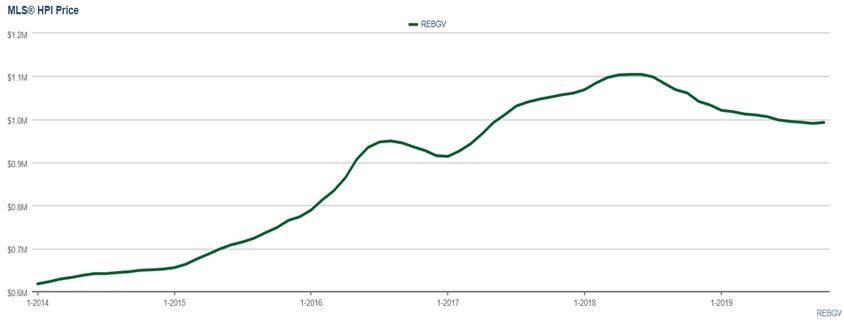
Home prices in most areas are currently still lower than this time last year but have flattened out over the last few months.
HOME PRICES
The benchmark price for a detached home was $1,410,500, down 7.5% from October 2018 but up 0.3% from September. The benchmark price for a townhome was $771,600, down 5.8% from this time last year but up 0.5% compared to September 2019. And the benchmark price for condos across the region was $652,500, down 5.9% from October 2018 but up 0.2% from September 2019.
NOT A BUYER’S MARKET ANYMORE
The average sales-to-active listings ratio across all property types for October 2019 was 23.4% which represents a Balanced Market. By property type, the ratio was 17.3% for detached homes, 26.2% for townhomes, and 29% for apartments. Analysts say a Buyer’s market occurs when the ratio dips below 12% per cent for a sustained period, and a Seller’s market occurs when the ratio surpasses 20% over several months.
![]()
However, some specific areas are experiencing Buyer’s markets and Seller’s markets:
Sample Buyer’s Markets: Tsawwassen Attached 9%, West Vancouver Houses 10%, West Vancouver Attached 11%
Sample Seller’s Markets: Vancouver Fairview Attached 53%, False Creek Attached 51%, Kerrisdale Attached 57%, East Side Attached 39%, North Vancouver Lonsdale Houses 60%, Harbourside Attached 88%, Port Moody Attached 62%, Burnaby Lake Houses 56%, Simon Fraser Houses 60%, Suncrest Houses 57%, Vancouver Heights Houses 62%, Willingdon Heights Houses 67%, Forest Hills Attached 67%, Simon Fraser Hills Attached 60%, New Westminster Connaught Heights Houses 60%, Glenbrook 60% Houses, The Heights Houses 70%, GlenBrooke Attached 86%, Coquitlam Canyon Springs Houses 400%, River Springs Houses 67%, Burke Mountain Attached 55%, Eagle Ridge Attached 86%, Port Coquitlam Lincoln Park Houses 75%, Oxford Heights Houses 67%, Port Coquitlam Glenwood Attached 70% and Riverwood Attached 64%.
To receive a complimentary SnapStats Report, email info@yourhometeam.com
Home Buyer Activity Increases in October
VANCOUVER, BC – Nov 4, 2019 – The Metro Vancouver housing market is experiencing a fall pickup in home sale activity.
The Real Estate Board of Greater Vancouver (REBGV) reports that residential home sales in the region totalled 2,858 in October 2019, a 45.4 per cent increase from the 1,966 sales recorded in October 2018, and a 22.5 per cent increase from the 2,333 homes sold in September 2019.
Last month’s sales were 9.8 per cent above the 10-year October sales average.
“Home buyers have more confidence today than we saw in the first half of the year,” says Ashley Smith, REBGV president. “With prices edging down over the last year and interest rates remaining low, hopeful home buyers are becoming more active this fall.”
There were 4,074 detached, attached and apartment homes newly listed for sale on the Multiple Listing Service® (MLS®) in Metro Vancouver in October 2019. This represents a 16.4 per cent decrease compared to the 4,873 homes listed in October 2018 and a 16.3 per cent decrease compared to September 2019 when 4,866 homes were listed.
The total number of homes currently listed for sale on the MLS® system in Metro Vancouver is 12,236, a 5.8 per cent decrease compared to October 2018 (12,984) and a nine per cent decrease compared to September 2019 (13,439).
For all property types, the sales-to-active listings ratio for October 2019 is 23.4 per cent. By property type, the ratio is 17.3 per cent for detached homes, 26.2 per cent for townhomes, and 29 per cent for apartments.
Generally, analysts say downward pressure on home prices occurs when the ratio dips below 12 per cent for a sustained period, while home prices often experience upward pressure when it surpasses 20 per cent over several months.
“The recent uptick in home sales is moving us into a more historically typical market,” Smith said. “Both sale and listing activity is trending around our long-term averages in recent months.”
The MLS® Home Price Index composite benchmark price for all residential properties in Metro Vancouver is currently $992,900. This represents a 6.4 per cent decrease from October 2018, a 1.7 per cent decrease over the past six months, and a 0.2 per cent increase compared to September 2019.
Sales of detached homes in October 2019 reached 938, a 47.3 per cent increase from the 637 detached sales recorded in October 2018. The benchmark price for a detached home is $1,410,500. This represents a 7.5 per cent decrease from October 2018, a 1.3 per cent decrease over the past six months, and a 0.3 per cent increase compared to September 2019.
Sales of apartment homes reached 1,384 in October 2019, a 40.5 per cent increase compared to the 985 sales in October 2018. The benchmark price of an apartment home is $652,500. This represents a 5.9 per cent decrease from October 2018, a 2.2 per cent decrease over the past six months, and a 0.2 per cent increase compared to September 2019.
Attached home sales in October 2019 totalled 536, a 55.8 per cent increase compared to the 344 sales in October 2018. The benchmark price of an attached home is $771,600. This represents a 5.8 per cent decrease from October 2018, a 0.4 per cent decrease over the past six months, and a 0.5 per cent increase compared to September 2019.
Download the October 2019 stats package


