


Mixed Start to the New Year for Vancouver’s Housing Market
After near record-breaking housing sales in 2016, the Vancouver real estate market started the year in January 2017 with a mix of cooling trends in some areas and hot spots in others.
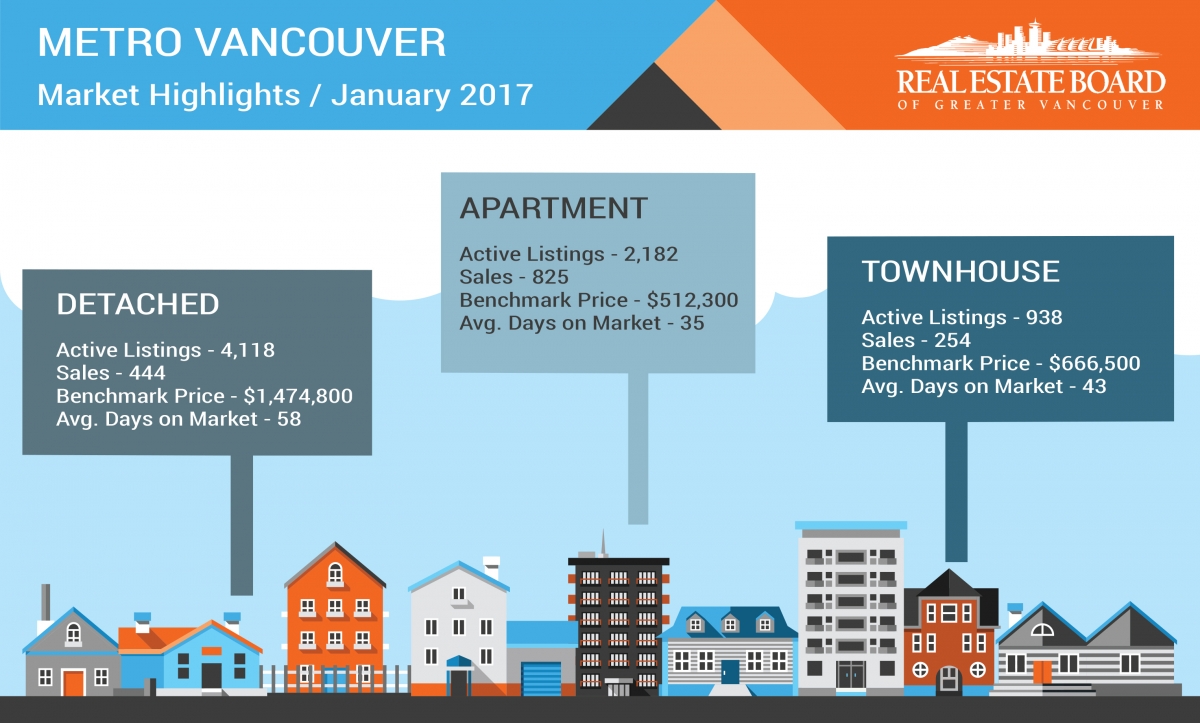
Overall, Vancouver residential real estate sales volume for January 2017 was down approximately 40% compared to January 2016. The average benchmark price for all residential properties declined 3.7 per cent over the past six months and 0.2 per cent over the last year. In particular, detached house prices dropped 7% over the past 6 months, while townhouse prices declined 0.4% over the same period.
However, the Vancouver condo market is still very active with prices rising 0.3% over the past 6 months with multiple offers in many cases. Also, several Vancouver suburbs, such as Port Moody, Maple Ridge, Pitt Meadows, Coquitlam, Port Coquitlam, and North Vancouver are still very active.
The overall Sales-to-Listings ratio for Metro Vancouver (which measures the % of inventory sold during the month, based on the number of properties sold during the month divided by number of listings that existed on the first day of the month) sits at 21 per cent, which is just on the boarder of a Balanced and Sellers market. This is the lowest this ratio has been in two years. However, as mentioned above several suburbs are still posting ratios 45% to 83% which makes them strong Sellers markets.
The Top Five Sellers Market Areas in January 2017 Were:
1. Port Moody Attached at 83% Sales ratio average
2. Pitt Meadows Attached at 81% Sales Ratio
3. Port Coquitlam Attached at 71% Sales Ratio
4. North Vancouver Attached at 47% Sales Ratio
5. Coquitlam Attached at 45% Sales Ratio
Some Examples of Buyer Market Areas Last Month Included:
- West Vancouver Detached at 6% Sales Ratio
- Vancouver Westside Detached at 7% Sales Ratio
- Ladner and Richmond Detached at 9% Sales Ratios
To receive a complimentary copy of your neighborhood SNAPSTATS analytics, email info@yourhometeam.com.
To see the Vancouver Real Estate Board’s complete news release and stats package – click here.


