


After flattening out in the summer, the real estate market rallied in the Fall and continued its positive trend in November with many areas moving from buyer’s markets to balanced markets and some into seller’s markets.
Canada Mortgage and Housing Corporation (CMHC) is forecasting price increases in 2020 in British Columbia: “Prices will start recovering in 2020, offsetting recent declines… Favorable economic and demographic conditions in British Columbia will support relatively strong growth in housing starts in the province when compared to other regions” … view report
According to Real Estate Board of Greater Vancouver (REBGV), Vancouver’s residential real estate market is recovering as home sales jumped 55% compared to a year ago November 2018.
“We started to see more home buyer confidence in the summer and this trend continues today,” says Ashley Smith, REBGV president.
The price of a typical detached home across the region is now $1,415,400, which is a 5.8% decrease from November 2018, but a 0.3% uptick compared with October 2019. The benchmark price of an attached home is $772,800, which represents a 4.4% decrease from November 2018 but a 0.2% increase compared to October 2019. The benchmark price of a condo is $651,500, which is 3.8% lower than in November 2018 and relatively flat since October 2019.
Sales-to-Active Listing Ratio
Rising sales and reduced listings are pushing the sales-to-active-listings ratio for most areas back up to balanced and seller’s market territory. Overall for all home types across Vancouver, the sales-to-active listings ratio for November was 23.2%. Broken down by property type, the ratio is 17.2% for detached homes (a balanced market), 24.9% for townhomes and 29.3% for condos (now firmly a seller’s market).
![]()
Sample Buyer’s Markets:
- Detached Houses: West Vancouver 12%, Vancouver Westside 11%, Richmond 10%
- Condos & Townhouses: Coal Harbour 12%, West Vancouver 11%, Kerrisdale 10%
Sample Seller’s Markets:
- Detached Houses: Main 100%, Hastings 60%, North Vancouver 31%
- Condos & Townhouses: Vancouver Eastside 47%, Mount Pleasant (Westside) 70%, Kitsilano 44%, New Westminster 45%, and Port Coquitlam 44%, North Vancouver 40%
To receive a complimentary SnapStats Report, email info@yourhometeam.com
***********************************************************************
December 3, 2019 – Vancouver BC – News Release
METRO VANCOUVER HOME SALES RETURN TO HISTORICALLY TYPICAL LEVELS
After a quieter first half of 2019, home buyer activity has returned to more historically typical levels in Metro Vancouver.
The Real Estate Board of Greater Vancouver (REBGV) reports that residential home sales in the region totalled 2,498 in November 2019, a 55.3 per cent increase from the 1,608 sales recorded in November 2018, and a 12.6 per cent decline from the 2,858 homes sold in October 2019.
Last month’s sales were four per cent above the 10-year November sales average.
“We started to see more home buyer confidence in the summer and this trend continues today,” says Ashley Smith, REBGV president. “It’ll be important to watch home listing levels over the next few months to see if supply can stay in line with home buyer demand.”
There were 2,987 detached, attached and apartment homes newly listed for sale on the Multiple Listing Service® (MLS®) in Metro Vancouver in November 2019. This represents a 13.7 per cent decrease compared to the 3,461 homes listed in November 2018 and a 26.7 per cent decrease compared to October 2019 when 4,074 homes were listed.
The total number of homes currently listed for sale on the MLS® system in Metro Vancouver is 10,770, a 12.5 per cent decrease compared to November 2018 (12,307) and a 12 per cent decrease compared to October 2019 (12,236).
For all property types, the sales-to-active listings ratio for November 2019 is 23.2 per cent. By property type, the ratio is 17.2 per cent for detached homes, 24.9 per cent for townhomes, and 29.3 per cent for apartments.
Generally, analysts say downward pressure on home prices occurs when the ratio dips below 12 per cent for a sustained period, while home prices often experience upward pressure when it surpasses 20 per cent over several months.
“In today’s market, the intensity of home buyer demand depends on neighbourhood, property type, and price point,” Smith said. “To better understand the changing trends in your neighbourhood and property type of choice, it’s important to work with your local REALTOR®.”
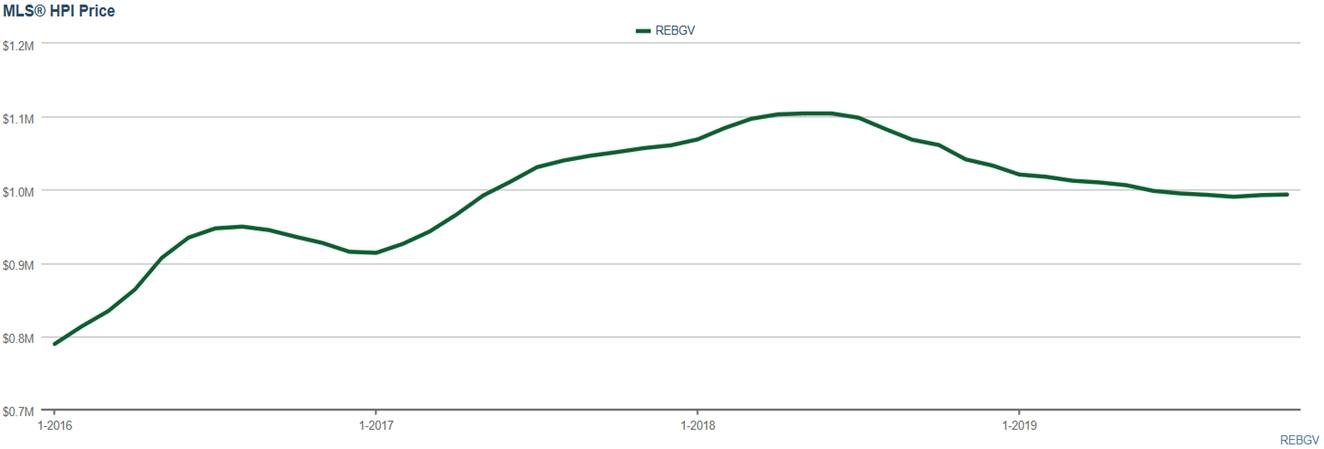
The MLS® Home Price Index composite benchmark price for all residential properties in Metro Vancouver is currently $993,700. This represents a 4.6 per cent decrease from November 2018 and a 1.3 per cent decrease over the past six months.
Sales of detached homes in November 2019 reached 825, a 59.9 per cent increase from the 516 detached sales recorded in November 2018. The benchmark price for a detached home is $1,415,400. This represents a 5.8 per cent decrease from November 2018, a 0.5 per cent decrease over the past six months, and a 0.3 per cent increase compared to October 2019.
Sales of apartment homes reached 1,222 in November 2019, a 50.9 per cent increase compared to the 810 sales in November 2018. The benchmark price of an apartment home is $651,500. This represents a 3.8 per cent decrease from November 2018, a 1.9 per cent decrease over the past six months, and a 0.2 per cent decline compared to October 2019.
Attached home sales in November 2019 totalled 451, a 59.9 per cent increase compared to the 282 sales in November 2018. The benchmark price of an attached home is $772,800. This represents a 4.4 per cent decrease from November 2018, a 0.8 per cent decrease over the past six months, and a 0.2 per cent increase compared to October 2019.
Download the November 2019 stats package


