


The new year started with a 42% jump in home sales volume compared to January 2019, while new listing inventory was down 20% from the same time last year.
In January, sales and prices continued the upward trend which started in the Fall of 2019 in most parts of Vancouver.
“We’ve begun 2020 with steady home buyer demand that tracks close to the region’s long-term average,” Ashley Smith, REBGV president said. “Looking at supply, we’re seeing fewer homes listed for sale than is typical for this time of year. As we approach the traditionally more active spring market, we’ll keep a close eye on supply to see if the number of homes being listed is keeping pace with demand.”
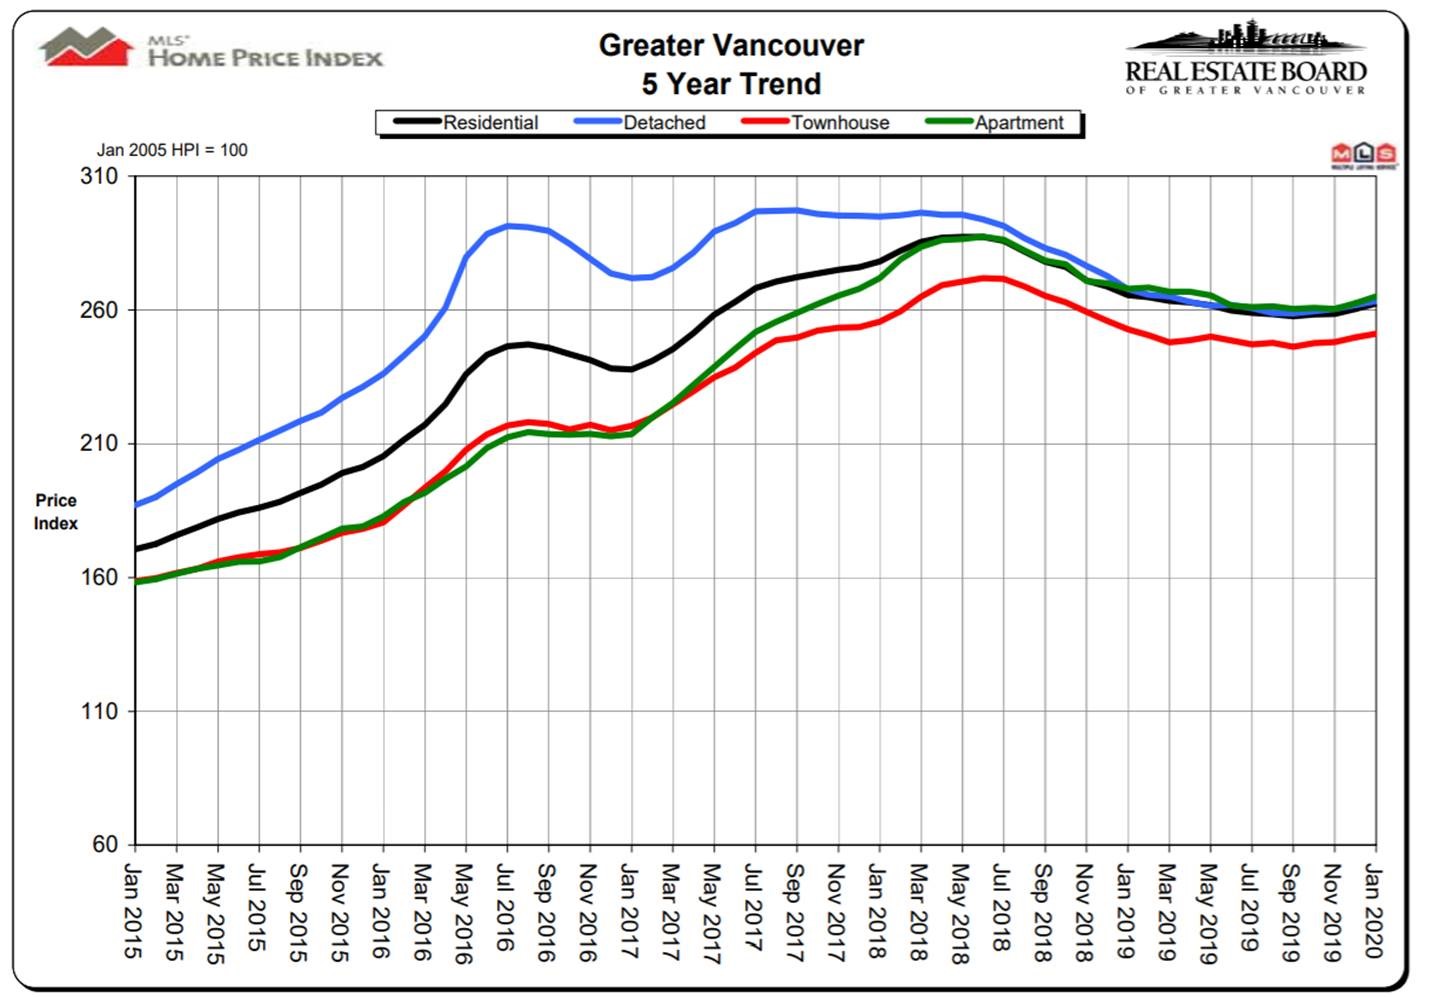
The MLS® Home Price Index composite benchmark price for all residential properties in Metro Vancouver is up 1.4 per cent over the past six months. Detached home prices increased 1% over the past 6 months, condo prices rose 1.5% over the last 6 months, and townhome prices increased 1.6% over the past 6 months.
Sale-to-Listing Ratios
Once again, there is a mix of results across neighbourhoods in the Lower Mainland.
Some neighbourhoods, such as Kitsilano, Main, Mount Pleasant, Burnaby, and Coquitlam are experiencing sellers’ markets and in some cases multiple offers.
Other areas, such as some parts of the West Side, West Vancouver and Richmond, are buyer’s markets where few homes are selling.
![]()
Sample Seller’s Markets
- Detached Houses: Kitsilano, Main, Mount Pleasant, Victoria, Government Road Burnaby, Willingdon Heights, Port Coquitlam
- Condos & Townhouses: Point Grey, False Creek, Kitsilano, Hastings, Fraser, Mount Pleasant, Lonsdale North Van, Ladner, Burnaby, Coquitlam, Port Moody
Sample Buyer’s Markets
- Detached Houses: Shaughnessy, West Vancouver, Richmond, Tsawwassen, Port Moody Centre
- Condos & Townhouses: Coal Harbour, South Granville, South Cambie, West Vancouver, Central & West Coquitlam
To receive a complimentary SnapStats Report, email info@yourhometeam.com
February 4, 2020
Home sale activity up, supply down to start 2020
Home sale and price activity remained steady in Metro Vancouver to start 2020 while home listing activity declined in January.
The Real Estate Board of Greater Vancouver (REBGV) reports that residential home sales in the region totalled 1,571 in January 2020, a 42.4 per cent increase from the 1,103 sales recorded in January 2019, and a 22.1 per cent decrease from the 2,016 homes sold in December 2019.
Last month’s sales were 7.3 per cent below the 10-year January sales average.
“We’ve begun 2020 with steady home buyer demand that tracks close to the region’s long-term average,” Ashley Smith, REBGV president said. “Looking at supply, we’re seeing fewer homes listed for sale than is typical for this time of year. As we approach the traditionally more active spring market, we’ll keep a close eye on supply to see if the number of homes being listed is keeping pace with demand.”
There were 3,872 detached, attached and apartment properties newly listed for sale on the Multiple Listing Service® (MLS®) in Metro Vancouver in January 2020. This represents a 20.1 per cent decrease compared to the 4,848 homes listed in January 2019 and a 143.8 per cent increase compared to December 2019 when 1,588 homes were listed.
Last month’s new listings were 17.4 per cent below January’s 10-year average.
The total number of homes currently listed for sale on the MLS® system in Metro Vancouver is 8,617, a 20.3 per cent decrease compared to January 2019 (10,808) and a 0.2 per cent increase compared to December 2019 (8,603), and is 13.7 per cent below the 10-year January average.
For all property types, the sales-to-active listings ratio for January 2020 is 18.2 per cent. By property type, the ratio is 11.6 per cent for detached homes, 22.6 per cent for townhomes, and 23.9 per cent for apartments.
Generally, analysts say downward pressure on home prices occurs when the ratio dips below 12 per cent for a sustained period, while home prices often experience upward pressure when it surpasses 20 per cent over several months.
The MLS® Home Price Index composite benchmark price for all residential properties in Metro Vancouver is currently $1,008,700. This represents a 1.2 per cent decrease over January 2019, a 1.4 per cent increase over the past six months, and a 0.8 per cent increase compared to December 2019.
Sales of detached homes in January 2020 reached 439, a 29.5 per cent increase from the 339 detached sales recorded in January 2019. The benchmark price for detached properties is $1,431,200. This represents a 1.7 per cent decrease from January 2019, a one per cent increase over the past six months, and a 0.5 per cent increase compared to December 2019.
Sales of apartment homes reached 814 in January 2020, a 45.6 per cent increase compared to the 559 sales in January 2019. The benchmark price of an apartment property is $663,200. This represents a one per cent decrease from January 2019, a 1.5 per cent increase over the past six months, and a one per cent increase compared to December 2019.
Attached home sales in January 2020 totalled 318, a 55.1 per cent increase compared to the 205 sales in January 2019. The benchmark price of an attached unit is $782,500. This represents a 0.7 per cent decrease from January 2019, a 1.6 per cent increase over the past six months, and a 0.5 per cent increase compared to December 2019.
Download the January 2020 stats package


